1. Introduction
2. Rethinking Internet Tools for Remote Learners
3. Networked CD-ROM Design
4. The Application
5. Summary
6. References
7. Ackowledgements


Hold the Java! Science Activities via Networked Multimedia CD-ROM's
Perry Samson, University of Michigan
Jeffrey Masters, The Weather Underground, Inc.
Robert Lacy, University of Michigan
David Cole, Sigma6, Inc.
Yohan Lee, University of Michigan
Nancy Butler Songer, University of Michigan

Abstract
The potential for Java applications to bring educational multimedia to remote learners is sometimes limited by the realities of hardware and networking. In response to these concerns, the One Sky, Many Voices program has developed a series of networked multimedia CD-ROM's to support its Internet science activities. This format allows delivery of rich interactive activities that contain animation and sound without long download waits and uses the Internet to facilitate communication of just that material which needs real-time updating.

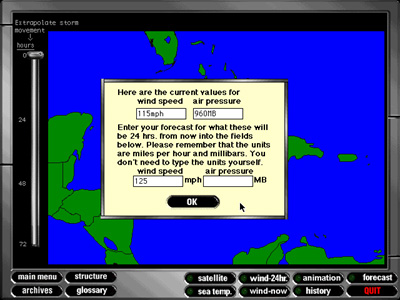
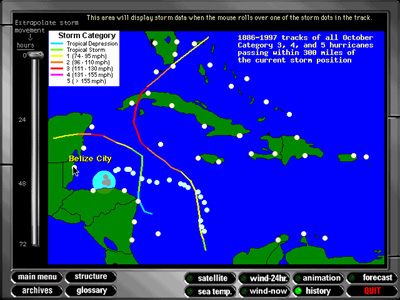
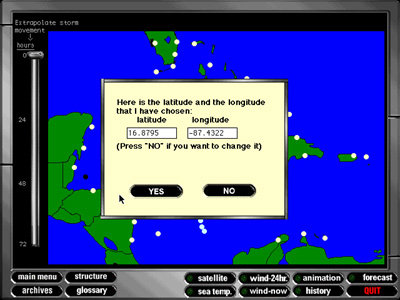
This new tool provides:

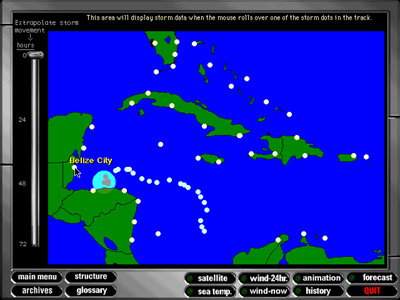
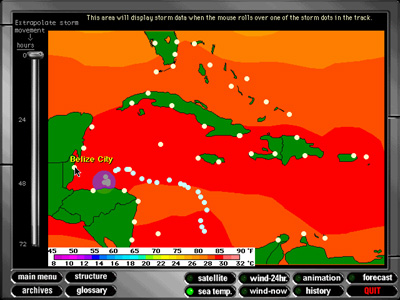
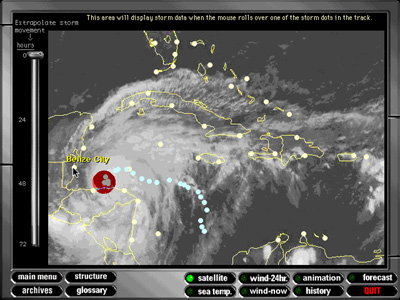
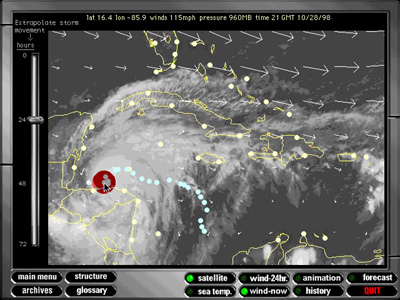
  • Internet access to current imagery and information as defined by the content author,
  • The ability to overlay fields to investigate interrelationships,
  • A drawing function to allow annotation by users,
  • A printing function for all images,
  • The ability to have learner responses sent to a database system, and
  • Communication of usage statistics directly to research database

This approach offers new opportunities for educational research and is an accessible medium for development of educational multimedia. Tested initially in a large population of K-12 classrooms, this approach was generally found to perform well technically and shows excellent promise for remote learner applications.


About the authors...


1. Introduction
The One Sky, Many Voices (OSMV) project reflects current thinking about how students learn best with emerging technologies that both make intelligent use of Internet resources and acknowledge the realities of classroom resources [Songer, 1998]. Our educational challenge is to create and distribute coupled curriculum and technologies that will enhance the learning opportunities of middle school students through exploration of real-time weather phenomena. Our technological challenge is to provide tools that provide a rich and stimulating environment for exploration while being sufficiently reliable over low bandwidth connections and even in the event of network outage. While the examples shown are specific to our K-12 research goals the technologies also hold promise for other remote learner situations where Internet access is limited and/or multimedia can enhance the learner's experience.

The OSMV project is a collaboration of the Kids as Global Scientists [URL1] program [Songer et al., 1996] and The Weather Underground [URL2] project. The latter project has worked to develop new technological approaches to exploration of weather information. Initially this effort resulted in the development of one of the first telnet based weather information systems [URL3]. Prior to the development of World-Wide-Web browsers the Weather Underground also created Blue-Skies [URL4], a Gopher-based software client that provides truly interactive weather maps. The project also maintains a complete set of weather-related web sites including WeatherNet [URL5], a popular table of contents for worldwide weather information.

While these resources serve the educational community through both programmatic curriculum developed by the Kids as Global Scientists [URL1] program and in independent classroom activities, we have learned from our experience that the technological limitations to their use result from at least four issues:

  1. Connectivity in classrooms is not sufficiently reliable to allow teachers to count on Internet resources;

  2. Classrooms often lack a sufficient quantity of Internet-connected computers to provide whole class access;

  3. Teachers in middle school and lower often have not had training in weather issues and need to be supported in Internet activities; and

  4. Internet resources are rarely designed in collaboration with educational curricula, which address classrooms’ needs to support state and national science learning objectives.

This paper addresses our coupled content/technological approach to items 1-3. The project approach to item 4 is contained elsewhere [Songer et al., 1996].


One Sky, Many Voices.


2. Rethinking Internet Tools for Remote Learners
The strength of the World Wide Web is its power to deliver information through user defined queries and to facilitate near-real-time collaboration. Classroom activities may take advantage of this through open exploration and/or guided inquiry delivered by specific resource and curriculum sites. While for many activities the ability to browse can lead to active exploration by the student, too often the information obtained provides minimal supporting explanation or the supporting explanation is at a level inappropriate for the student. Thus the user’s experience may not result in the desired level of learning. Likewise, the exploratory strength of browsers also can lead to off-task inquiry that distracts the students from reaching their learning objectives.

Second, the reliability of Internet connections, while improving, is still not sufficiently robust to support scheduled classroom activities in many situations. Hardware and software failures, unavailable dial-in access, and server failures are among the issues that may prevent a classroom from successfully participating in a scheduled Internet activity. Moreover, the depth of multimedia experience afforded by fixed media such as CD-ROM and DVD-ROM will probably exceed the depth possible through network transfer for some time to come.

To address these concerns we chose to design networked CD-ROM’s which support our curriculum by providing real-time but prescribed weather information from the Internet (Figure 1). These information are selected by content experts in meteorology in collaboration with education specialists. The real-time imagery and information is supported by linked multimedia explanations on the CD-ROM. Education and content guidance is delivered to the user through the CD interface.


figure 1


Figure 1. An illustration of the initialization process for Hurricanes’98 CD-ROM. Note that by the time the program has reached the initial screen it had already checked a weather server to see if there is a current tropical storm in the Atlantic.


Activities have varied from curriculum to curriculum but the model has been to build a knowledge base through active exploration that leads to a prediction activity. In Hurricanes'98, for example, the students were provided archived hurricanes and tropical storms as well as a "fly-through" hurricane. These resources lead the student to understand the morphology of a hurricane and the conditions that lead to hurricane intensification and decay.

This construction of a knowledge base was followed by an activity where students were to predict the motion of either an archived tropical storm or, had nature provided, a live hurricane. The design would have allowed participating students to forecast which cities on the East Coast of the United States should receive hurricane warnings.


3. Networked CD-ROM Design
The selection of CD-ROM multimedia was based on the observation that combining technologies provides important features for the educational community (Table 1).


Internet Affordances
  • Current information
  • Communication
  • Contributions of students incorporated into program
  • Worldwide scope
CD-ROM Affordances
  • Lower memory demands than Java-enabled browser
  • Archived information for non-networked or broken networked situations
  • Rich content including interactive images, animations, sounds
  • Easy distribution of large programs and data files

Table 1. Benefits of Combining Technologies


The quality of a networked CD-ROM for educational purposes is judged by its ability to meet its educational goals within predefined technical constraints. At the outset it is necessary to define the typical user, the expected frequency of use of the CD-ROM resources, the network demands inherent in use of the program and what level of customization was desirable for the student. Table 2 lists, as an example, the criteria used to design the Hurricanes’98 CD-ROM.


Project
Hurricanes'98
Goals
  1. Provide access to real-time weather imagery in support of Hurricanes'98 curriculum activities.
  2. Support important concepts with interactive multimedia examples.
  3. Provide prediction tool wherein user would be forecasting hurricane movement for either archived or "live" tropical storm track.

Creative Considerations
  1. Provide virtual fly-through of hurricane with capability for user to record weather observations in order to build conceptual model of hurricane from this experience.
  2. Provide creative interactive animations to build understandings of complex concepts such as the Coriolis Force, pressure gradient, and others.

Technical Considerations
  1. End users have range of computer facilities available so application size must be kept minimal.
  2. Users also will typically have lower connectivity speeds so imagery size must be kept modest.

Target Audience

Students in 3rd through 9th grades accessing the Internet either from classroom settings or at home.

Frequency of Use

Specific parts to be used at specific times during the four week curriculum.

Attention Factor

This is a captive audience, no need to call attention to the screen. In fact, extraneous sounds or animations might be distracting in a classroom setting.

Customization

Users should be able to overlay different meteorological fields in order to analyze and forecast hurricane motion.


Table 2. Design considerations for Hurricanes’98 CD-ROM.


One of our overriding design constraints is to keep our technology accessible to the widest possible population of classrooms. The memory demands of this system have been kept smaller (~6 MB) than is typically needed for a Java-enabled browser (>10 MB). Moreover the system anticipates needed imagery and data and preloads much of the information into a cache. To conserve bandwidth we have designed the imagery to be limited to 256 colors.

The CD-ROM tests whether network capability exists by searching for a file on our server. If the attempt times-out the network is assumed to be unavailable and further communication attempts are canceled and the data source is assumed to be from archives on the CD-ROM (see Figure 1). If the initial file is successfully returned the file contains information on the existence of tropical storms in the Atlantic (Figure 2). This information is transmitted to the users on the opening navigation screen so they can choose to explore real-time imagery. Likewise the hurricane prediction activity is switched to a live mode to facilitate forecasting the current storm.


Figure 2

Figure 2. The opening screen of the Hurricanes'98 CD-ROM illustrating that the CD-ROM layout has been modified by the remote server to bring attention to a current tropical storm.


At the same time information is transmitted from the CD-ROM to our server identifying when the software was started, which sections are accessed, and whether the program terminates normally. These data are stored in support of our research on technology utilization.


4. The Application

Students use the CD-ROM as an integral part of several activities. If a tropical storm is active in the North Atlantic Ocean a 'current weather' section of the program is activated and students may view the imagery selected by the CD authors (Figure 3) to explore the storm. Likewise, if there is no storm present or the user's network connection is unavailable the user can elect to use archives in place of live information. If questions arise about terminology used in the real-time maps or with concepts about tropical storms they can visit the glossary section of the program. Figure 4, for example, is a Shockwave animation of a glossary definition of the Coriolis Force.


Figure 3

Figure 3. An example of a live update to the CD-ROM data during Hurricane Mitch.


Once they have reviewed the storm locations (live or archives) they are challenged to forecast the movement and intensification or dissipation of the storm. Figure 5 shows the map of hurricane movement for Hurricane Mitch as viewed using the Hurricanes'98 CD-ROM. Dots indicate the every six hour movement of the storm center.


Figure 4. Interactive glossary explanation of Coriolis Force.

in line demo This Shockwave for Director demo (2.6MB) shows the map of hurricane movement for Hurricane Mitch as viewed using the Hurricanes'98 CD-ROM (requires Shockwave for Director plugin)


Figure 5

Figure 5. Locations of Hurricane Mitch movements as superimposed in real-time within the CD-ROM. Users are able to determine the characteristics of the storm at each interval by rolloing over the location dots. Major cities are also presented so the user can specify which cities should receive tropical storm warnings and watches.


Hurricane intensification and movement is influenced by physical features including sea-surface temperature and wind flow above the surface. Users can select from background maps of real-time (or archived, as appropriate) sea surface temperature and infrared satellite images (Figure 6). On top of these they can overlay images of steering winds (Figure 7) and a climatology of storm tracks for previous storms in the vicinity of the current storm. Based on this information the student is challenged to forecast the position of the center of the tropical storm in 24 hours.


Figure 6 - current sea surface temperatures

Figure 6 - satellite imagery

Figure 6. Base maps of current sea surface temperatures (warmer water increases the likelihood of storm intensification) and satellite imagery provide a backdrop for storm movements.


Figure 7 - steering winds now

Figure 7 - projected winds

Figure 7 - history of storm tracks

Figure 7. The ability to add transparent overlays allows users to decide which combination of information sources best allows them to forecast the storm movement. With a satellite map as background the users can choose steering winds now, projected winds in 24 hours, and a history of storm tracks when a storm passed near these coordinates.


The forecasting is performed in stages with users first clicking on the map where they expect the storm to be located in 24 hours. This click records a latitude and longitude (Figure 8) . Users are then asked about the central pressure and wind speeds expected for this storm. The response is recorded by the program and communicated to our project server where it is stored.


Figure 8. The user's forecast is determined by clicking on the map in the location the user expects the storm to be in 24 hours. The user is then presented with the latitude and longitude represented by the click and is given the opportunity to modify his or her forecast. Results are communicated from the CD-ROM to the project server.


The next day all forecasts are compared with the actual storm location and the difference is computed. At the same time the forecast of the National Hurricane Center is also scored. The results are made available to the schools. During the forecast period for Hurricane Mitch, when the storm moved very slowly and with little guiding winds above the surface, it was not uncommon for some participants to make more accurate forecasts than the National Hurricane Center on specific days.


5. Summary 
The results of this project from an educational standpoint are still being evaluated. Nonetheless, the demonstration that Internet-savvy CD-ROM's can be used as an authored, project specific medium offers an alternative model for use of the Internet for remote learners. The activities were more interactive than would have been possible using standard browsers without significant download times and memory requirements, offered continuity even when network connections were unavailable, and still embraced the communicative power of the Internet.

Internet-savvy CD-ROM’s offer a valuable alternative to building educational software in support of science education. The ability to include real-time information embedded in a rich multimedia environment offers curriculum designers new options for authoring. The advantages of this approach include the ability to include case studies of real-time information, high bandwidth multimedia without long download times, and prescribed access to Internet resources keeping the students on task in a focused learning environment. It is our expectation that this approach holds promise for a wide range of science learning initiatives, particularly where real-time information can play a vital role in the learning process.


6. References 


1. Songer, N.B. (1998) Beyond ‘Real School’ Obstacles: Ten essentials for adoption of technology-rich programs in urban middle schools. Proceedings of the Third International Conference on the Learning Sciences (ICLS ‘98), p. 270-276.


Click to go to the body text where this is cited.


2. Songer, N.B. (1996) Exploring Learning Opportunities in Coordinated Network-Enhanced Classrooms: A case of kids as global scientists. The Journal of the Learning Sciences 5(4), 297-327.


Click or to go to the body text where this is cited.


3. [URL1] Kids as Global Scientists: ttp://www.onesky.umich.edu/KGS99/


Click or to go to the body text where this is cited.


4. [URL2] The Weather Underground: http://blueskies.sprl.umich.edu/


Click to go to the body text where this is cited.


5. [URL3] Telnet based weather information: telnet://mammatus.sprl.umich.edu:3000


Click to go to the body text where this is cited.


6. [URL4] Blue-Skies: http://blueskies.sprl.umich.edu/BS.html


Click to go to the body text where this is cited.


7. [URL5] WeatherNet: http://cirrus.sprl.umich.edu/wxnet/


Click to go to the body text where this is cited.


7. Ackowledgements 
The One Sky, Many Voices project is funded, in part, by The National Science Foundation, Education and Human Resources Division.

********** End of Document **********


IMEJ multimedia team member assigned to this paper Ching-Wan Yip