| 1. | Introduction |
| 2. | Examining Instructional Tasks |
| 3. | Task Analysis |
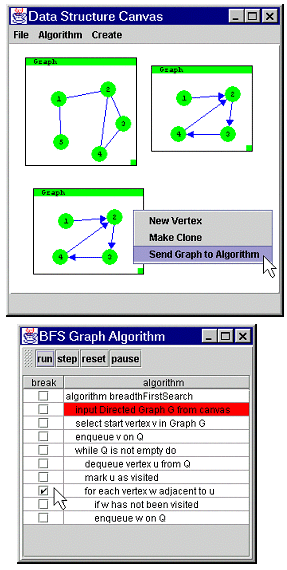
| 4. | SKA Design Overview |
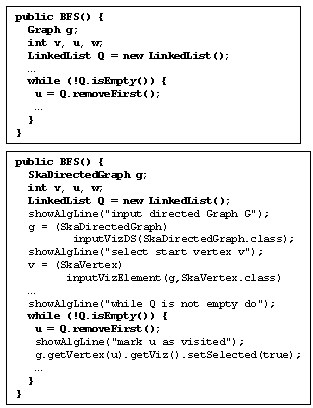
| 5. | Authoring |
| 6. | Future Work |
| 7. | References |
![]()
Designing an Algorithm Animation System to Support Instructional Tasks
Ashley
George Hamilton-Taylor, University of Georgia
Eileen Kraemer, University of
Georgia
Abstract
Existing
algorithm animation systems typically have been designed without formal
study of related teaching practices. We believe that this has contributed
to low adoption rates of these systems. We are conducting a study of instructors
teaching data structure and algorithm topics, with a focus on the use
of diagrams and tracing. The results of this study are being used to inform
the design of SKA, the Support Kit for Animation. We describe a preliminary
version of SKA, and possible usage scenarios.
1. Introduction
Over the
past decade and a half, a number of algorithm animation systems such as
POLKA [12], Zeus [2] and CAT [3] have been implemented. Despite their
impressive technical features, studies of their effectiveness have generally
produced mixed results [4,9], though a few studies have shown positive
results [6]. Moreover, algorithm animation systems are far from being
a standard part of teaching practice for relevant courses.
We believe that the appropriate starting point in the design of an algorithm animation system is to examine the tasks instructors perform and the context of these tasks. We have therefore adopted a contextual design [1] approach, in which the first step is to study the user’s existing tasks and workflow. Design proposals are made with the objective of improving the existing system, while a careful attempt is made not to displace aspects of the existing workflow process that enable the tasks to be accomplished. We believe that this design methodology will result in algorithm animation teaching tools that are far more relevant to the needs of both instructors and students. In a similar vein, Hundhausen has conducted ethnographic studies of how students construct algorithm animations, and used the results in the design of SALSA and ALVIS [7].
Another issue that impacts the use of algorithm animation systems is the time it takes to author an animation. The average instructor lacks the free time to create algorithm animations. Some systems, for example Samba [11], have attempted to address this issue, but it appears to be largely unresolved. In one study, Hundhausen found that students took an average of 33 hours to produce a Samba animation [7]. One must write code to create, display, and modify data structures such as graphs and trees in all but a few systems such as JAWAA [10] and Object-TRAKLA [8]. We have attempted to minimize authoring time by providing an extensible library of visual data structure objects, and a set of simple operations that facilitate access to these objects.
2. Examining Instructional
Tasks
In order to
inform the design of SKA, we are conducting an ongoing study of computer
science instructors conducting algorithms and data structures classes.
We are particularly interested in identifying the types of data structure
diagrams used, and classifying how they are used. This study is being
conducted over a number of semesters so that we can observe a number of
instructors. So far, two instructors have participated. We have identified
a set of topics that will eventually include the most commonly taught
algorithms and data structures. The relevant classes are videotaped, and
we subsequently ask students to allow us to photocopy their class notes
so we can see what they have captured and compare it to the videotaped
material.
Our present approach to videotape analysis is to divide topics (e.g., binary search trees) into subtopics (e.g. binary search tree insertion), and divide the subtopics into segments - for example, an introductory discussion, examples, further discussion, and analysis. We identify the tasks performed in each segment and the time spent on each task, noting any use of diagrams. We also record the use of annotations and gestures used in conjunction with the diagrams. An example of this is the following summary of the binary search tree deletion video session:
![]()