| 1. | Introduction | ||||||||||
| 2. | Instructional Need | ||||||||||
| 3. | COR's Instructional Model | ||||||||||
|
|||||||||||
| 4. | Programming Environment and Use of Technology | ||||||||||
| 5. | Use and Evaluation | ||||||||||
| 6. | Summary and Future Directions | ||||||||||
| 7. | Availability | ||||||||||
| 8. | References |
![]()
Scaffolding Students from Knowing to Applying: Using COR to Teach
Observational Research Methods
Carla
N. Torgerson,
Penn State Erie , The Behrend College
Dawn G. Blasko, Penn State
Erie , The Behrend College
Victoria
A. Kazmerski, Penn State Erie , The Behrend College
Jacob A. Cornwell, Penn
State Erie , The Behrend College
Abstract
This paper
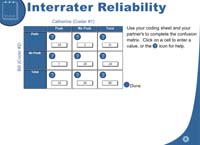
discusses Courseware for Observational Research (COR),
an interactive multimedia program designed to teach methods of observational
research from the initial phase of hypothesis generation through the final
stage of data analysis and interpretation. The program uses video with interactive
coding activities, a case study, and a laboratory component to teach students
key concepts and applications. The program is designed to gradually decrease
the level of assistance until students are applying the research methods
on their own. The case study, in particular, helps students to apply their
learning in a realistic setting. Evaluations have shown that COR enhances
student confidence and improves learning.
![]()